Day 177: Making Browserflow 24x Faster
About a week ago, I noticed that Browserflow was feeling quite sluggish. I mean, there’s a lot involved in automating a browser, but it just seemed way too slow to be reasonable.
Starting point
To set a baseline, I wanted to see how fast a script should run in the absence of any automation. To be honest, this isn’t much of a helpful comparison because it’s not reasonable to expect that an application that’s issuing one command at a time to a page will get anywhere close to the performance of running a loop that’s optimized by modern Javascript engines.
The test case that I came up with is simply printing to the console. Here’s what it looks like running for one second (I’m guessing printing continues for much longer than a second because they’ve been queued up during the second of execution):
The final result: 18,000 prints
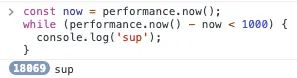
Again, not really that useful as a baseline, but interesting to know.
In order to measure Browserflow’s performance, I recreated the script above using Browserflow’s commands, except I made it run for 10 seconds instead of 1:
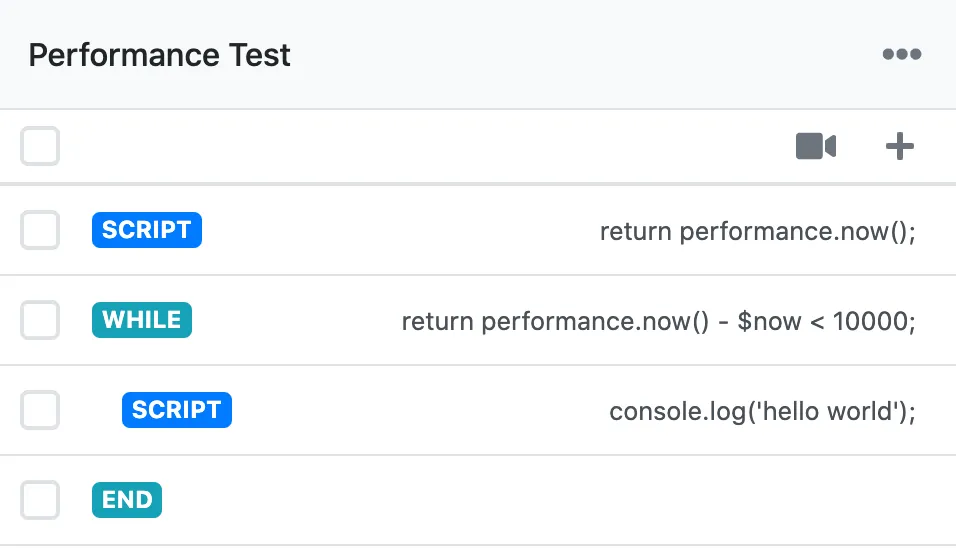
If this were running directly in the inspector, it would print over 180,000 times in 10 seconds.
So how does Browserflow do?

It prints 27 times over 10 seconds. Hell, I could copy and paste on my keyboard faster than that.
Here’s a snippet of it running:
To be clear, performance isn’t the highest priority for task automation. It’s much more useful to have a slow automation that runs reliably than a fast one that works 80% of the time. For many tasks, the speed of the automation isn’t even important — the benefit comes from not having to do it yourself.
But less than three prints a second? That just seems like bad engineering.
Identifying the problem
Browserflow has three main execution contexts:
-
Background script
The background script is the command center that manages executing the flows. It keeps track of which flows to run, what command to execute next, and how to execute each command.
-
Popup
The popup is the window that you see on the left in the video above. It’s the user interface for all of Browserflow where you can create flows, run them, and edit them.
-
Content script
The content script runs in the active tab and helps Browserflow do things like detect and interact with various elements on the page. In the example case above, the host page doesn’t really matter since I’m just printing to the console (I’m using
example.com).
In order to run a flow, Browserflow needs to coordinate between these contexts. For example, here’s what happens when running the SCRIPT command that executes console.log:
- The background script tells the content script to run the
console.logscript - The content script executes the script and returns control back to the background script
- The background script updates the log and saves the result of the command
- The popup receives the update and refreshes the screen to show the new information (what command is running now, logs, etc.)
After mucking around, I discovered that step 3 was taking a long time. The background script uses the WebExtensions storage API to store updates, and it does so by modifying a runner object that holds information about the flow being run.
The operation to save the runner was taking quite a while, so I looked at what was being saved:
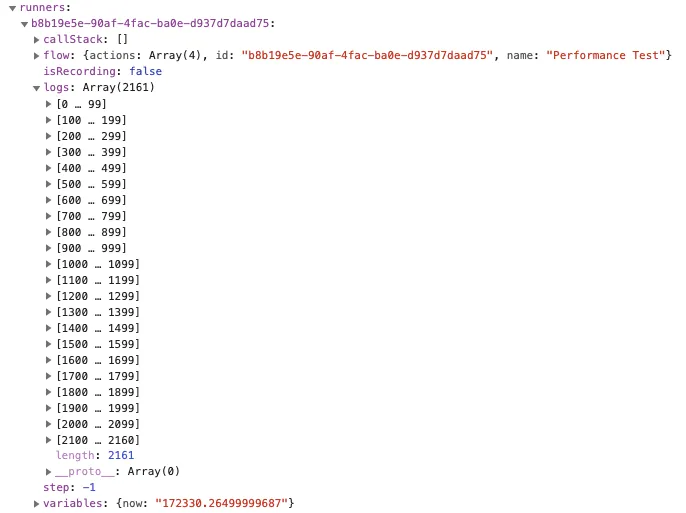
Oh. This object was huge.
Smaller updates
I had been appending to the log but never clearing it, meaning that it had just accumulated a bunch over time. What if I tried disabling logging entirely to shrink the data being saved?
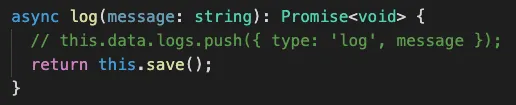
I ran the flow again. The result?

Much faster! By limiting the size of the data being saved, I’d found an 8x improvement.
Message passing
In addition to the the storage API, there’s another way to communicate between different contexts in browser extensions: message passing.
What if instead of updating the storage, I passed messages from the background script to the popup to communicate updates?
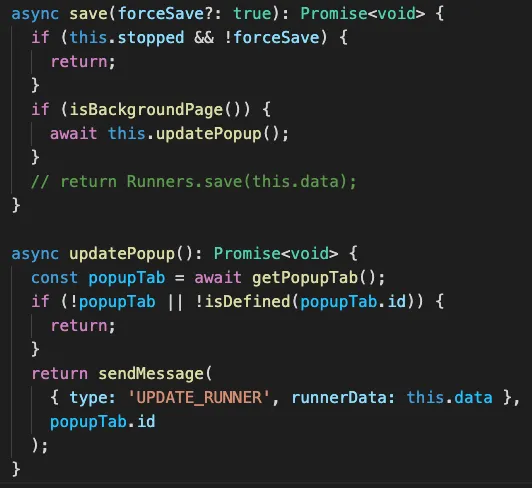
For this test, I used the log-less version of the runner from the “Small Save” strategy:

Eh, disappointing. Saving the data instead of sending it as a message had been more than twice as fast.
Small(er) message passing
But there’s an aspect of message passing that I wasn’t taking advantage of. With saving data to storage, I have no choice but to save the entire object every time because it’s written over what was previously saved.
But with message passing, I don’t have that limitation. In other words, instead of sending the entire object, I can send just the parts that changed. Adding something to the log can be a message that looks like { type: 'LOG', message: shortString } rather than { type: 'UPDATE_RUNNER', runnerData: largeRunnerObject }.
What would happen if I shrank the size of the message being sent?

Huh, no difference. I guess the object is already small enough that a tiny reduction just doesn’t make a dent.
Fewer updates
In my excitement to compare mediums for communicating (storage vs. message passing), I’d ignored a fundamental question I should’ve looked at to start with: Just how many updates was I making?
The result of some runs using the “smaller updates” strategy:
- 68 prints, 490 updates sent, 490 updates received = 7.2 updates per print
- 76 prints, 546 updates sent, 546 updates received = 7.2 updates per print
I was wondering why these numbers were significantly lower than when I first tried the smaller updates strategy. One cause is that I was using a later version of my code which kept 50 logs instead of 0. Here are runs with no logs being saved:
- 161 prints, 1141 updates sent, 492 updates received = 7.1 updates sent per print
- 130 prints, 925 updates sent, 399 updates received = 7.1 updates sent per print
What I learned:
-
The WebExtensions storage API seems to cap updates to storage listeners at around 40-50 per second even if there are more calls to save
- (I ran the same experiment with message passing and found that no messages were dropped even at 170+ messages sent per second)
-
With my current implementation, I’m saving to storage 700 times for every time I run the loop 100 times.
No wonder it was choking. 🤦🏻♂️
Throttled save
To avoid saving on every little change, I used Lodash’s throttle function to save a maximum of once every 50ms:
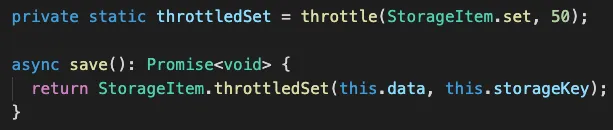
The result:

Oh baby. Now we’re talking.
And the ~400 updates received dropped to a much more reasonable ~150 updates over 10 seconds, or about 15 updates per second.
The performance improves even more if I bump up the throttle wait period even more, but it comes with a tradeoff. Even though the flow runs faster, the popup is updated less frequently, which means that the popup can be out of sync with the command that’s being executed. Also, even at 50 ms, the faster flows counterintuitively appear slower than the slower ones (compare the popup updates in the last two video clips).
I still haven’t decided whether the popup lagging behind the actual execution is a dealbreaker. What’s more important: Running flows quickly or making it easy to follow along?
At high speeds, tracking the progress doesn’t matter because everything executes so quickly anyway, but it’s nice seeing the highlighted command in the popup. I’m going to evaluate whether the user experience feels acceptable as I continue using it, and most likely, I’ll add a “slow-mo” mode that slows down the flow to make it easier to follow.
Takeaway
Here’s what I learned from this investigation:
If the performance bottleneck comes from saving data to the WebExtensions storage API, make smaller and fewer updates.
So simple, and yet it took me hours and hours of debugging and testing to figure it out. But now Browserflow runs flows 24x faster!